A recent article in Farmers Weekly criticised Defra for not collecting soil organic matter data they paid for in SFI. Luckily quite a bit of that data has been added to Soil Benchmark, so I thought it might be interesting to do some of the analysis that Defra is missing out on.
Last week the Sustainable Soils Alliance revealed that no usable soil assessment information has been gathered from Defra's Sustainable Farming Incentive (SFI), despite £65 million being spent on soil assessment actions. I have to agree that this is a missed opportunity.
To recap, SFI initially included actions (SAM1 and CSAM1) that paid farms around £6 per hectare to test their soils for soil organic matter (SOM) and produce a soil management plan. These were the most popular actions in SFI (~75% of agreements in SFI24) until their removal earlier this year. The plans often prompted valuable conversations about soil management and the subsidy supported many farms with their first SOM baseline. This comes at a time when estimates suggest 40% of British soils are degraded, at a cost of £1.2 billion every year (2010 estimate for England and Wales). I (wrongly) assumed the hundreds of thousands of SOM results associated with these actions would be used to better understand how SOM varies across England, how land use has shaped this variation, and to inform the future design of SFI.
To showcase what national-scale soil data can tell us, I put my soil scientist hat back on and explored a subset of the soil data uploaded to Soil Benchmark recently. The resulting data included ~13,000 anonymised soil organic matter records from across England.
The data
- 13,236 anonymised fields with soil organic matter records, from 620 farms.
- 6,853 arable fields and 6,383 permanent grassland fields.
- Where more than one SOM record for a given field was present, the mean SOM value was used.
- 92% of fields were tested in or after 2023.
Grassland holds more organic matter in every region
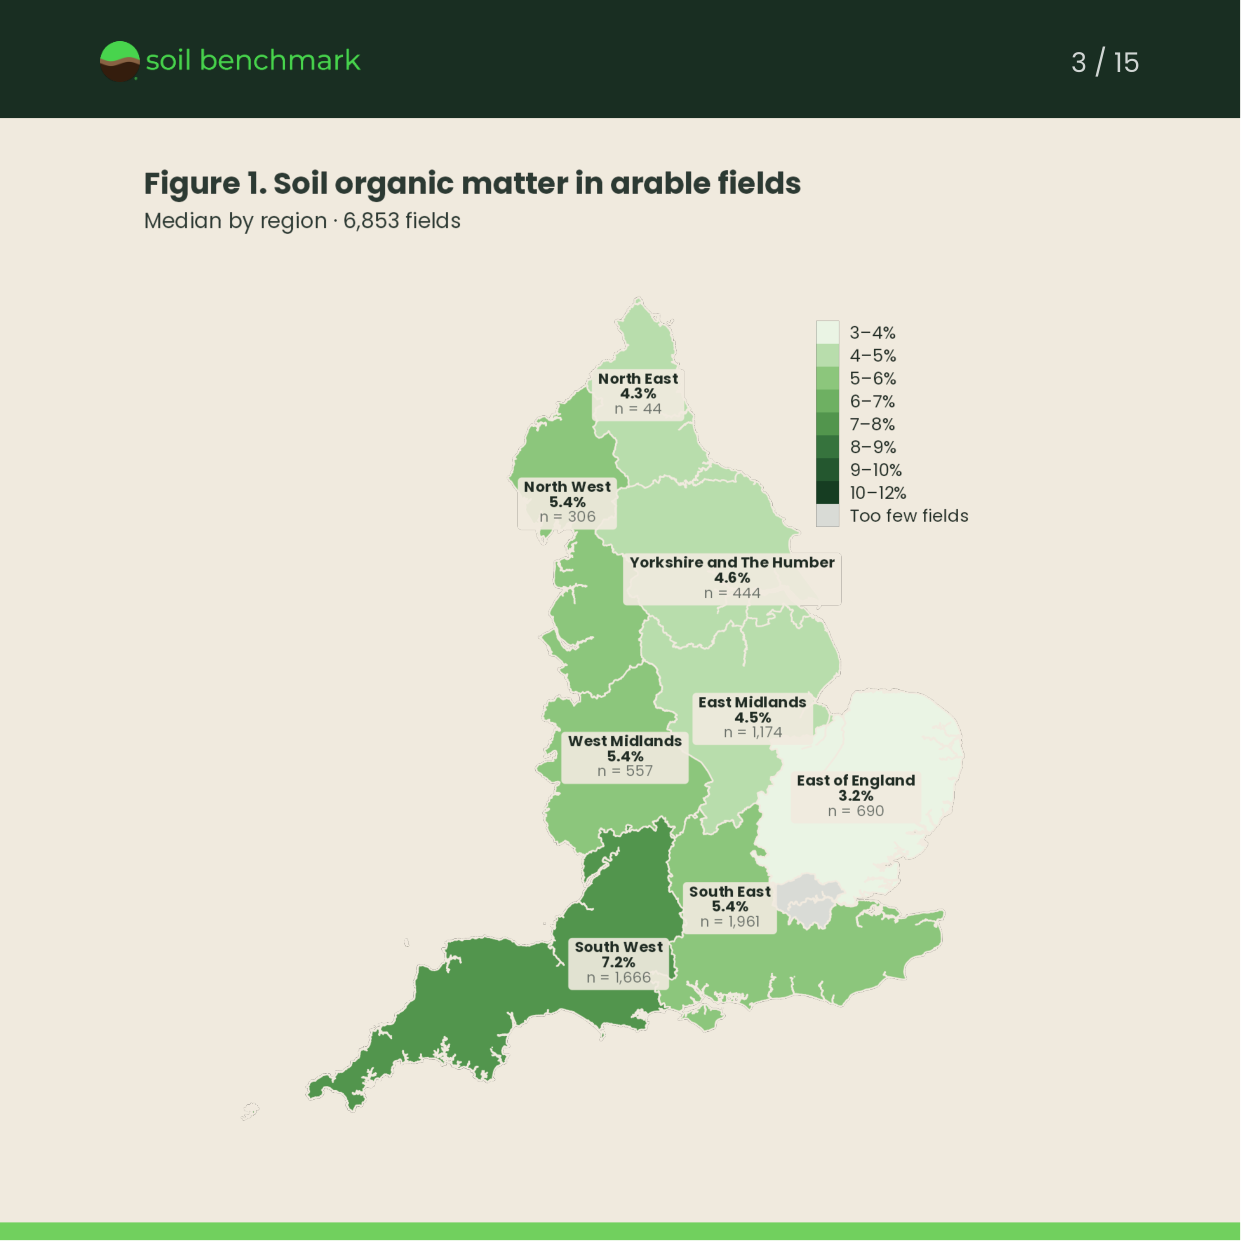

- In every region, the median SOM concentration of permanent grassland fields is above that of arable fields. The difference is statistically significant (p < 0.001) in all regions except the East of England.
- Lowest SOM concentrations are in the East of England (3.2% arable, 4.6% grassland); highest in the South West (7.2% arable, 10.0% grassland).
- Dominant land use varies widely by region: permanent grassland makes up 12% of tested fields in the East of England and 81% in the North West.
Nationally the gap is about two thirds
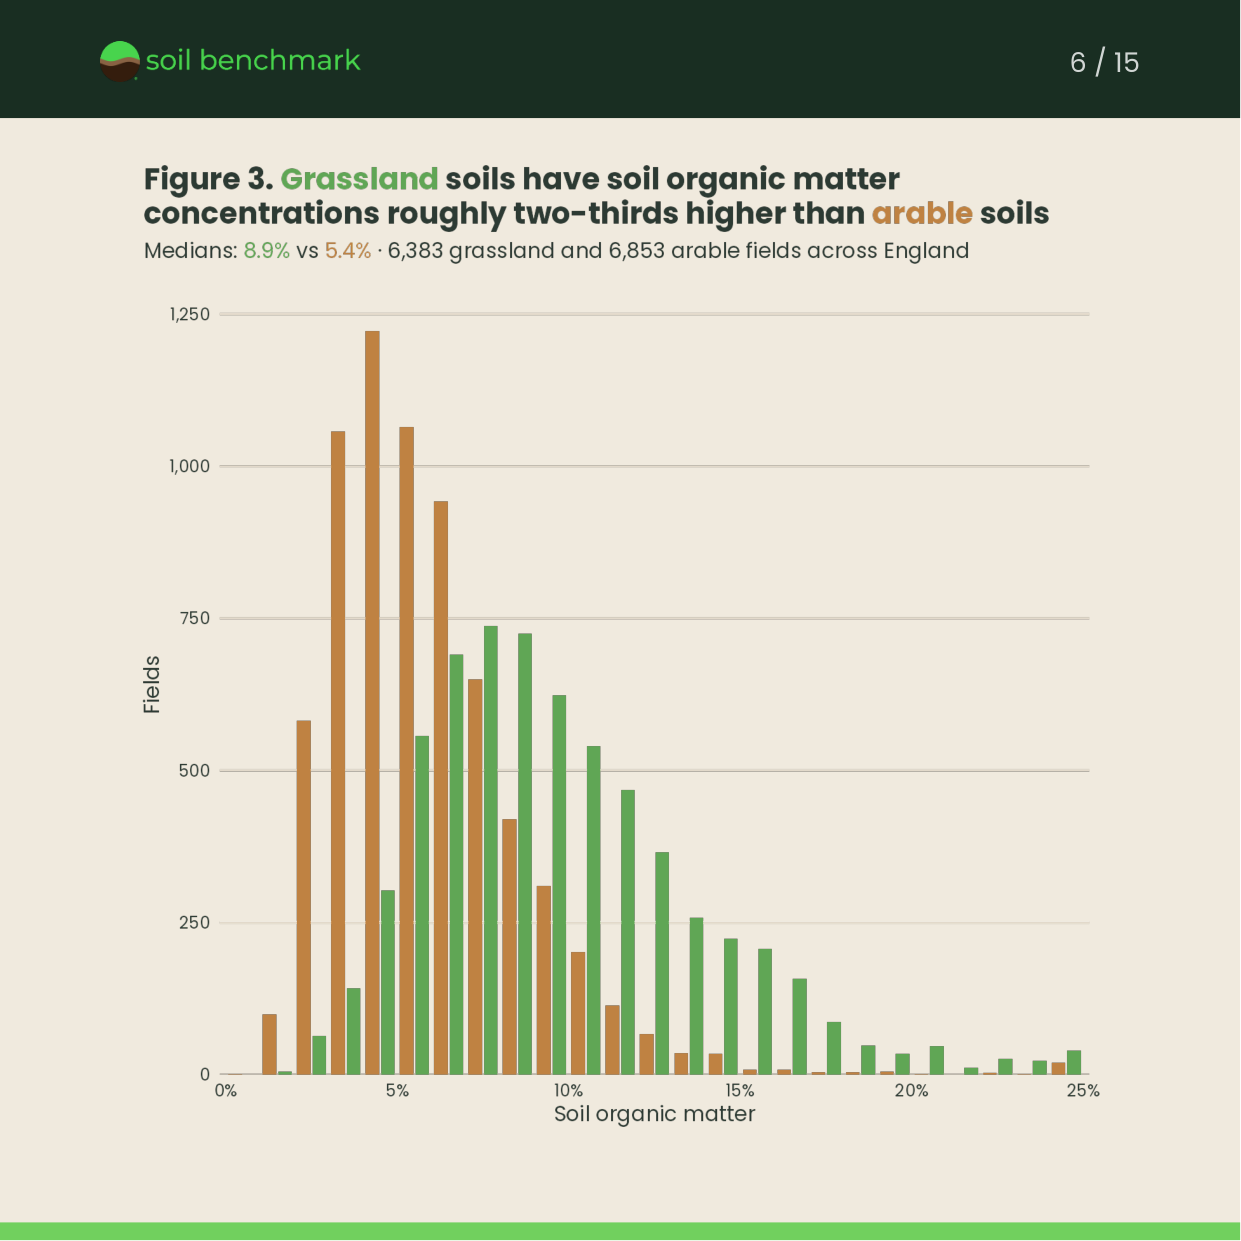
- SOM in permanent grassland fields is significantly higher than in arable fields (p < 0.001).
- Median SOM concentration: 8.9% for grassland fields, 5.4% for arable fields.
- Below 5% SOM: 8% of grassland, 43% of arable.
- Above 15% SOM: 10% of grassland, 1% of arable.
It holds on nine out of ten individual farms

- 216 farms have at least three fields with SOM records in each land use studied. On 186 of those farms (86%), the average grassland field holds more SOM than the average arable field.
- Within a farm, grassland fields hold 35% more SOM than arable fields, which equates to a difference of approximately 2% SOM.
- The pattern holds across the full range of SOM concentrations encountered in the dataset.
67% to 45% to 35%, but it never closes
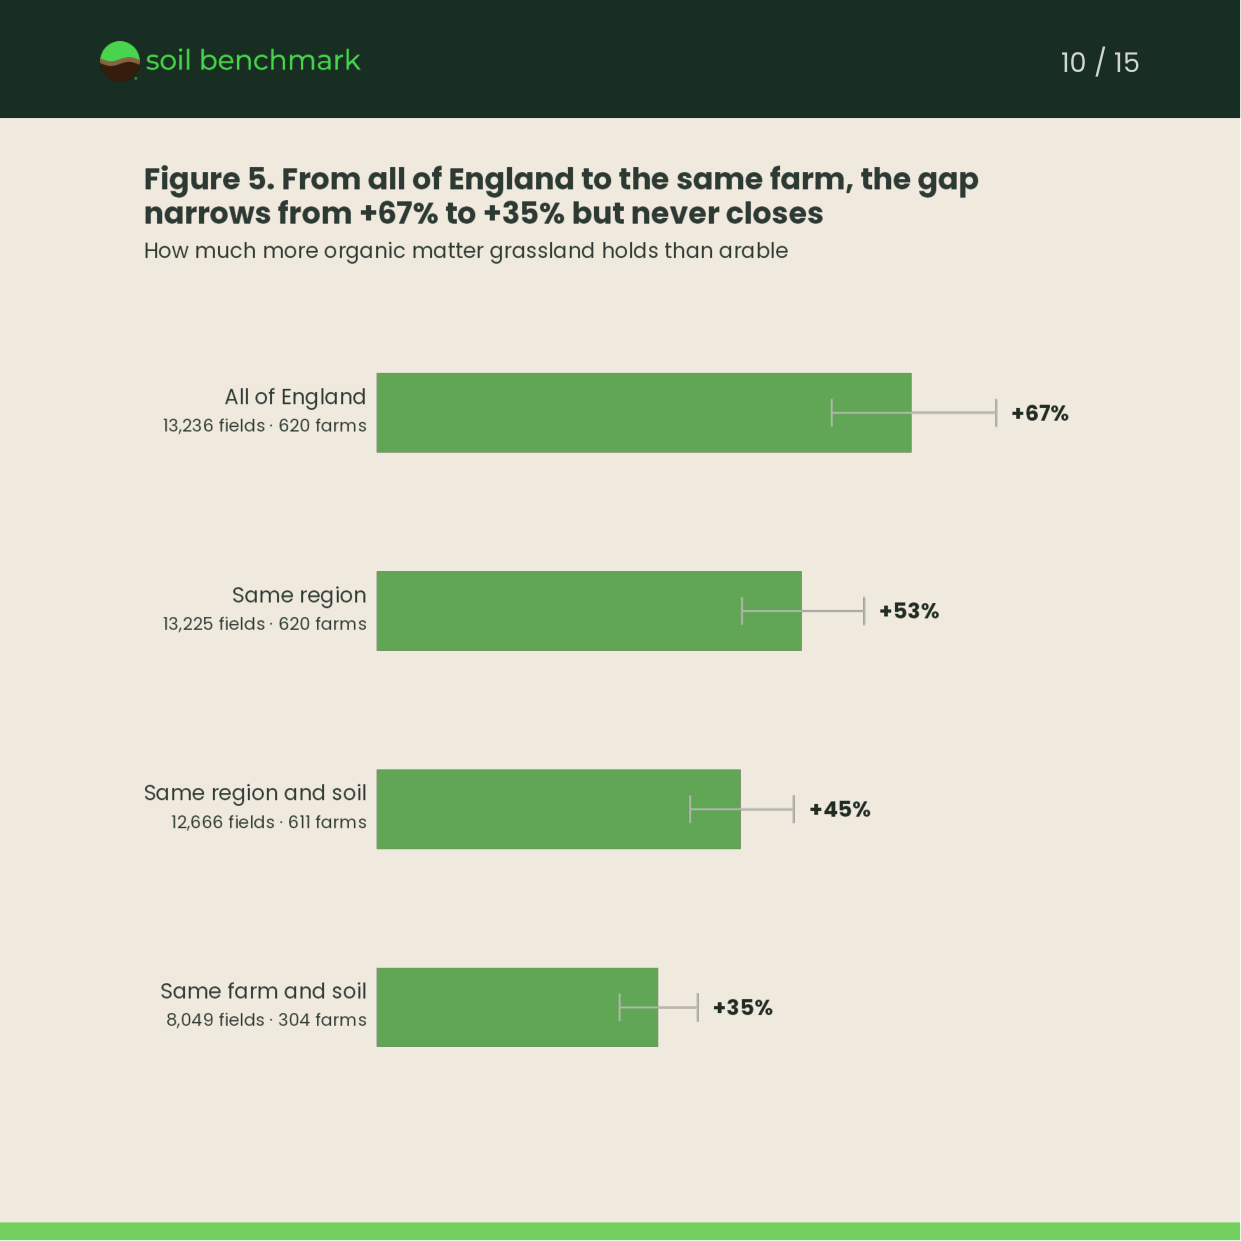
- Across England as a whole, grassland fields hold 67% more SOM than arable fields. Accounting for region and soil type reduces that difference to 45%.
- When comparing data from the same farm and same soil type, the gap is reduced to 35%.
- The remaining difference will reflect factors not captured in this data.
- Every bar, and every step between them, is statistically significant (p < 0.001).
Why might the 35% gap persist at the farm level?
- Sampling depth. Standard UK practice samples arable soils to 15cm and permanent grassland soils to 7.5cm. SOM concentrates near the surface under grass, so the convention might bias the results.
- Land use bias. Land is not assigned to permanent grassland at random. Soil forming factors such as higher rainfall, heavier parent material and steeper relief make land harder to crop and tend to raise SOM.
- Cultivation. Tillage and the consistent removal of harvested biomass typically results in arable fields being at greater risk of losing SOM. The Environment Agency estimates intensive agriculture has cost arable soils about 40 to 60% of their organic carbon.
This dataset cannot separate these, but collated SFI results might have a chance.
Why look at soil data at this scale?
- Results from 13,000 fields gave regional SOM benchmarks. Larger datasets could track change over time and provide more local benchmarks.
- Drawing conclusions for an individual farm, rather than patterns across many, needs more data again given the inherent variability and complexity of soil.
- Despite this dataset being tiny in comparison to the 10.9 million hectares covered by SAM1 and CSAM1 agreements between 2023 and 2026, consistent differences were seen that can help identify areas for action or further investigation.
Together this has left me wondering whether future iterations of SFI can include actions that result in a better understanding of this consistent deficit of organic matter in arable soils and, if appropriate, specifically work towards reducing it.
What would you love to know about soil organic matter distributions and changes? Get in touch at ben@soilbenchmark.com.
References
- AHDB. Nutrient Management Guide (RB209): Measuring soil nutrients, pH and organic matter.
- Bentley, L. et al. (2025). First signs that national cropland organic carbon loss is reversing in British topsoils. European Journal of Soil Science 76, e70131.
- Environment Agency (2023). Summary of the state of the environment: soil.
- Farmers Weekly (2026). £65m soil scheme missed chance to build national picture, reporting a Freedom of Information request by the Sustainable Soils Alliance.