🦉 Update on CS Mid-Tier & it's SFI impact:
👏 Huge credit to Martin & Nature Friendly Farming Network (+ many others) for helping secure Defra funding to roll over thousands of Countryside Stewardship Mid-Tier agreements
Without it, large areas that have spent years under agri-environment schemes could have been ploughed up, losing habitats that have developed over decades. 🌱
💷 The money for this, though, will almost certainly come from the Sustainable Farming Incentive (SFI) pot = even tighter rationing when SFI26 is 🤞 announced next year.
As part of the announcement Angela Eagle MP said “Plans for SFI are currently being reviewed to ensure the availability of funding for that scheme is distributed more efficiently and more fairly.”
🔍 Looks like caps on large claims from big farms. At first glance, this seems to be a shift towards social policy, redistributing 💰 to smaller farms in the name of fairness.
⚠️ But I think it would be dangerous for farming. With a hard-nosed Treasury, the only long-term justification for SFI is delivering progress towards government environmental targets.
So the real debate is how to design SFI to deliver the greatest environmental benefit per £
🌍It’s often said SFI was used up mainly by lowland farms, especially those with agents who applied quickly, leaving out upland areas where environmental return per hectare might have been greater. If true, that might strengthen the argument for caps.
📊But I wanted to check whether the anecdote was actually backed up in the data (🤓 alert).
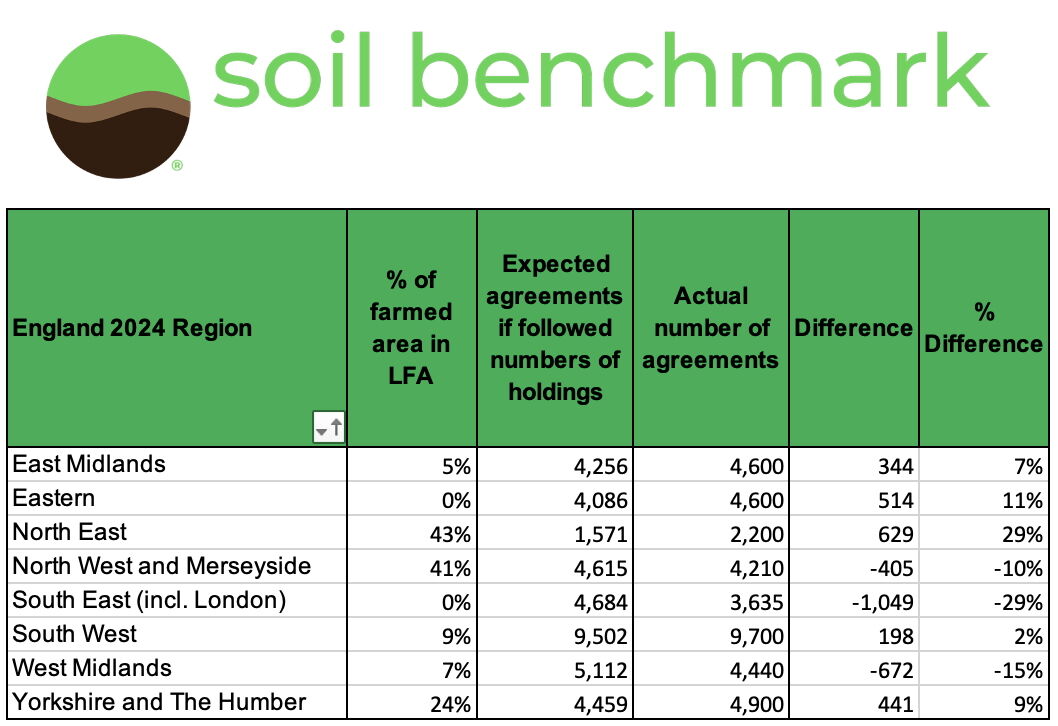
I compared the number of SFI agreements in each region to the number of farm holdings. It turns out uptake was pretty even across the country (with a few outliers):
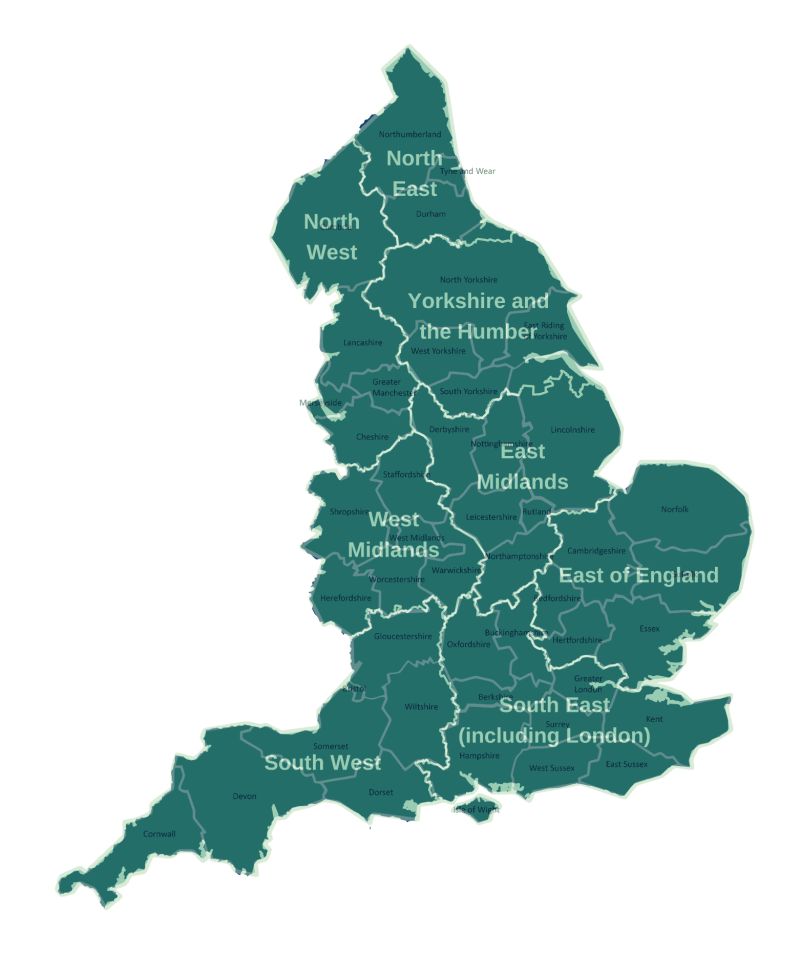
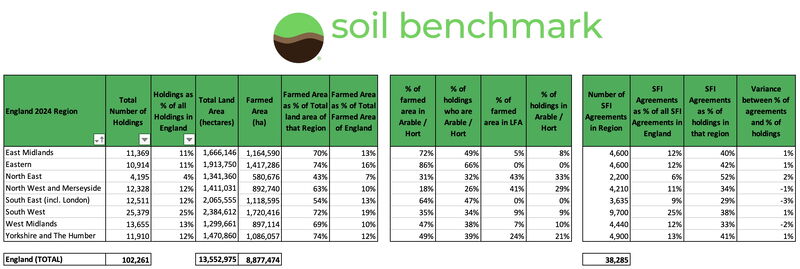
📈 The North East (where 43% of farming is on marginal uplands known as “Less Favoured Areas”) has c.4,200 holdings (4% of England’s total). If SFI takeup was evenly spread, you’d expect 1,570 agreements. Instead, there were 2,200 (+29%).
By contrast, the North West (also a high 41% LFA) had 4,210 agreements vs an expected 4,615 (-10%). Meanwhile, the South East (-29%) and West Midlands (-15%) has low takeup despite having relatively little LFA land.**
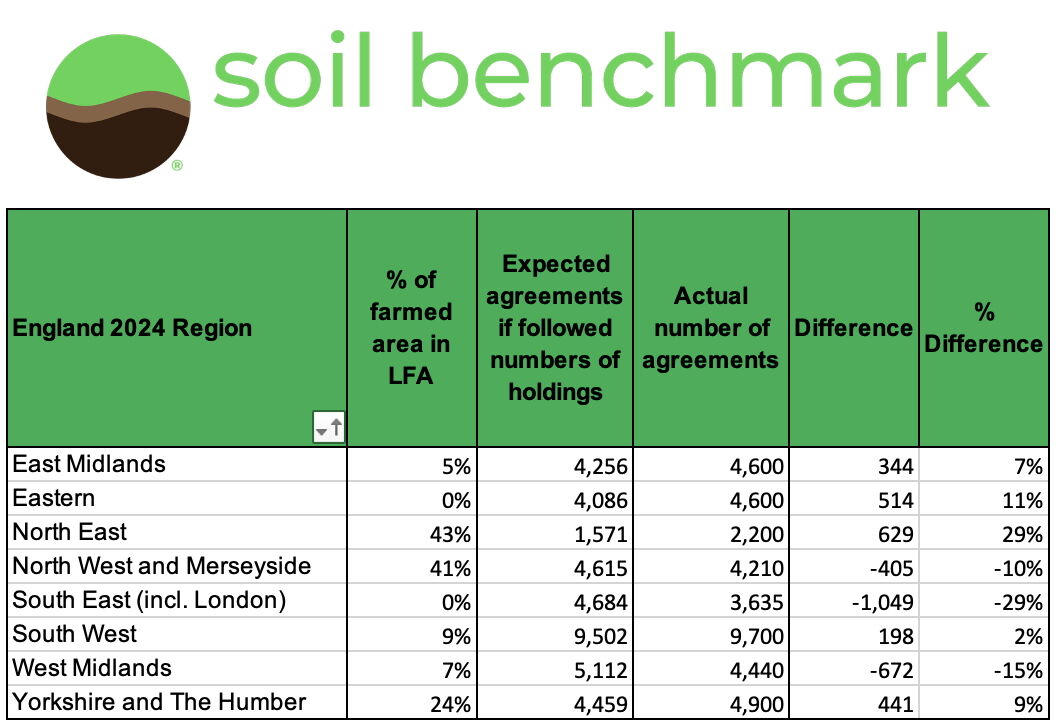
Overall there doesn’t appear to be a simple “uplands left out” story.
🤔 So what do you think?
💭 Was the existing SFI actually already quite fair, at least in how it spread funding across the country?
💭 Were the real unfairnesses caused not by geography but by Countryside Stewardship overlaps or admin barriers that stopped some farms joining?
💭 Would capping payments deliver higher (or at least =) environmental outcomes per £?
💭 Should SFI include a social element, even if that risks HMT budget cuts?
**Defra only publishes this data at regional level, which may be masking variation within regions. County-level data would help reveal whether, for example, the North East’s higher-than-expected uptake was concentrated in its arable coastal areas rather than among upland farms.